Staff Metrics
Learn what data Drawbridge uses to calculate metrics for your staff.
Written By Daniel Gleaves
Last updated 19 days ago
Drawbridge generates three types of metrics: overview, employee, and personal. This article explains how each of these metrics are calculated and how you can utilize this information in your venue.
Overview Metrics

At the top of the Overview screen, you’ll find a collapsible row of numbers. As each section is clicked, more information is given about the schedule, hours per game, number of games, and status of games. The following sections will break down each segment of the overview metrics.
Hours
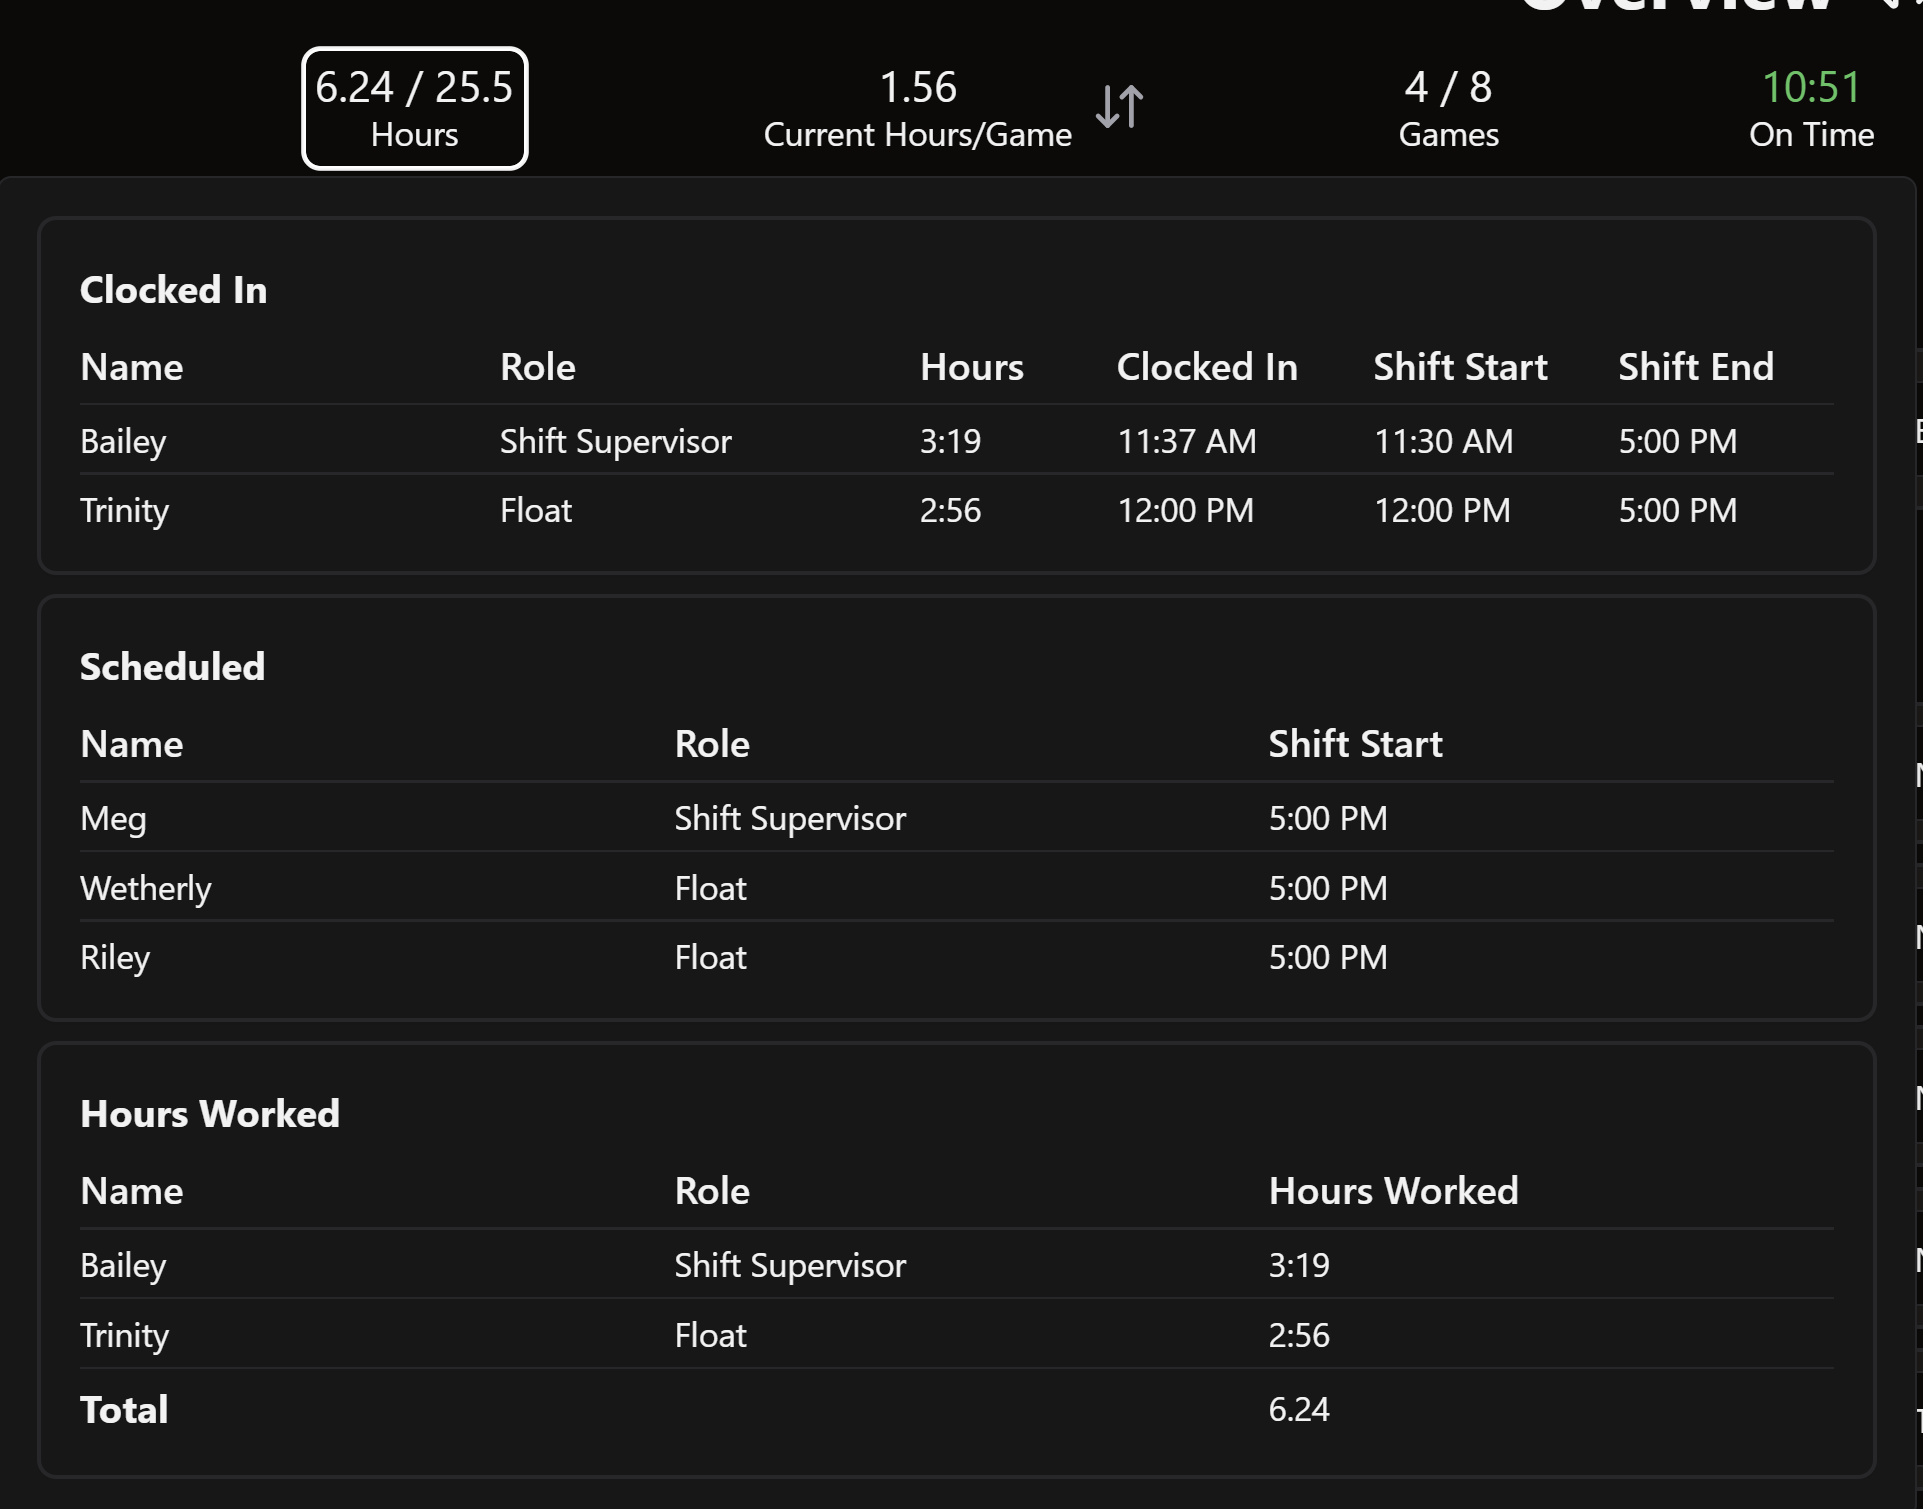
The hours tab shows the total hours worked / the total hours scheduled in a day. When this is clicked, a popup appears with three sections.
Clocked In displays all employees that are currently clocked in, their scheduled role, how many hours they have been clocked in for, the time that they clocked in at, when their shift was scheduled to start, and when it should end.
Scheduled displays all employees that are scheduled today and have yet to clock in. If an employee is not clocked in and it is past their scheduled clock in time, their row will turn red to highlight this. This section also displays the employee’s scheduled role and when their shift is scheduled to start.
Hours worked displays the names, roles, and hours worked of all employees who have clocked in today. This section does not include the amount of time that an employee spent on break.
Hours per Game
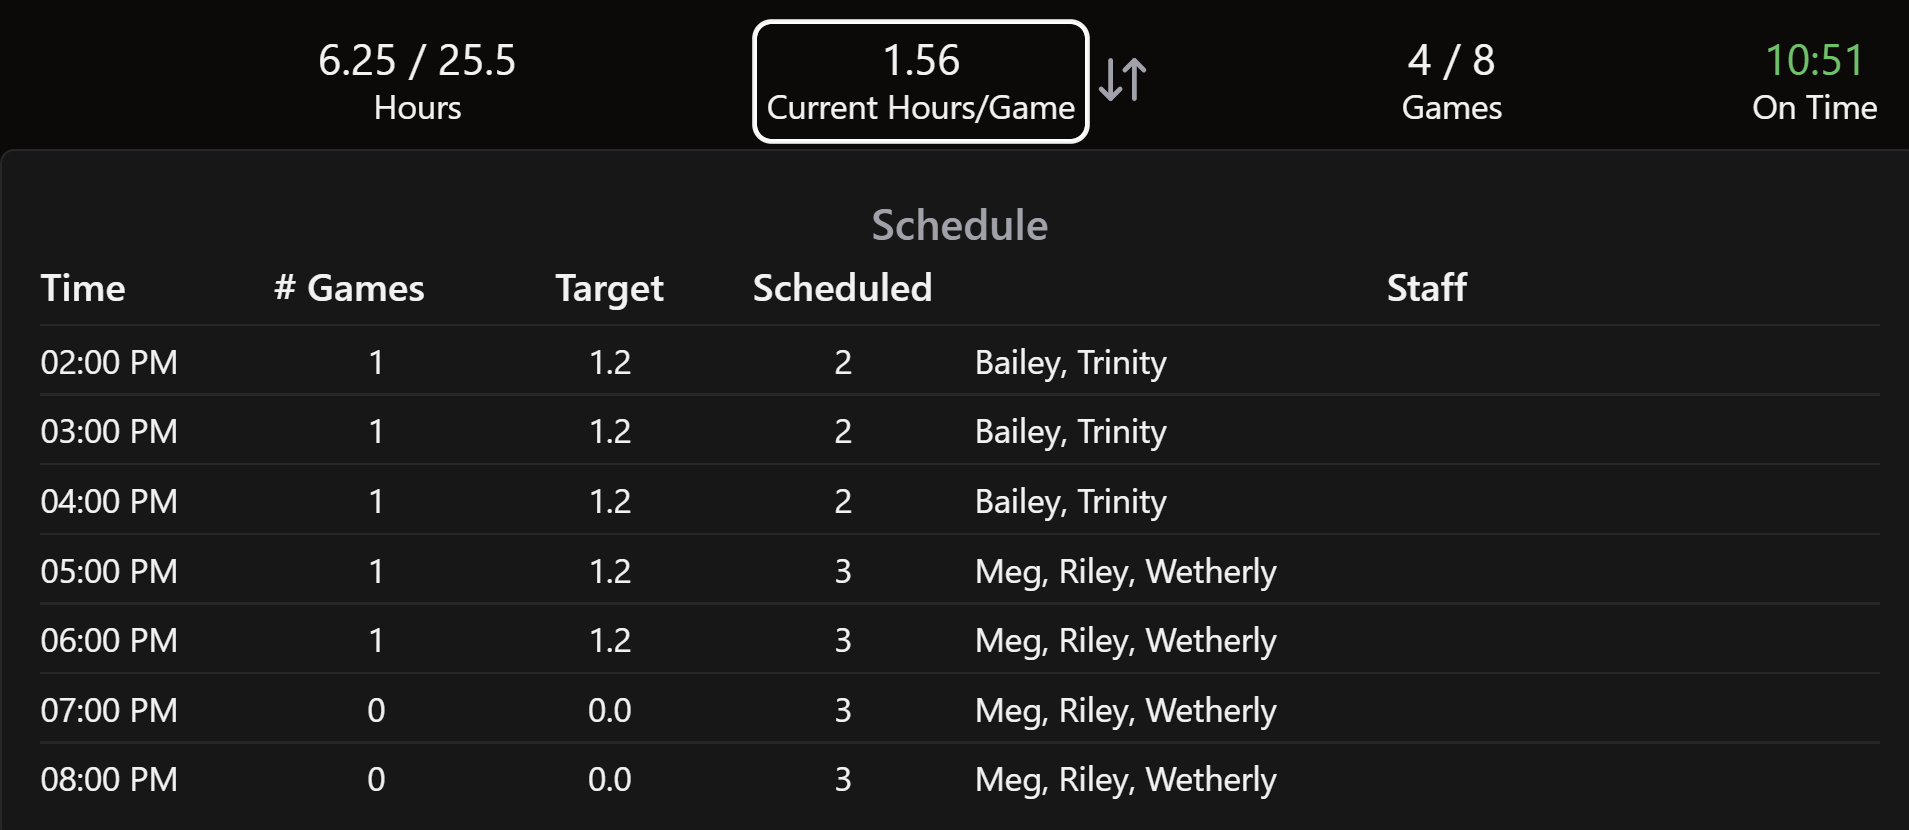
This calculation only pulls hours from roles in the operations and management categories. This means that any training, overhead, etc. roles will not be included in what is displayed.
The number displayed above hours/game divides the total hours of completed or ongoing shifts by the total number of completed games in a day.
Clicking the arrows beside the hours per game calculation toggles the predictive future hours per game calculation. Future hours per game divides all completed, ongoing, and upcoming shifts by the total number of games in a day (automatically accounting for and removing any canceled bookings).
Toggling the future hours per game does not impact the popup that appears beneath hours per game when it is clicked on. This popup displays the number of games by hour for the whole day, the target staffing hours (which can be set in settings > general settings > incentives), and which employees are scheduled during that hour.
Games
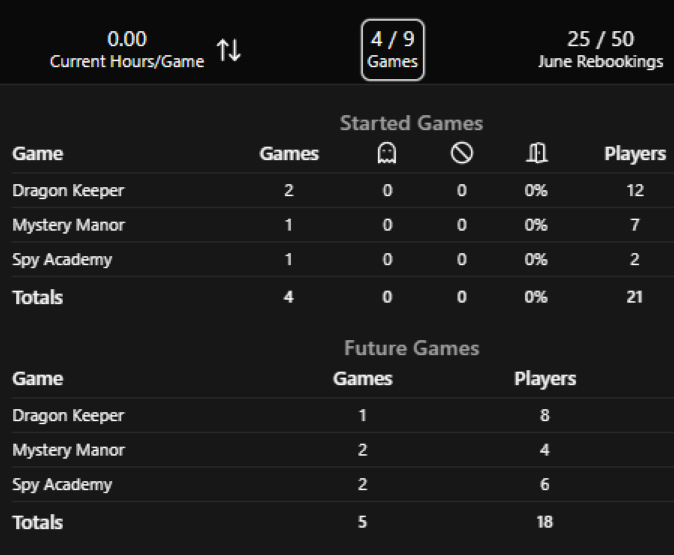
The numbers displayed above the games tab show the number of games that have started or finished / the total number of games scheduled on a given day.
The popup separates games by current or completed games and future games. It lists all games by name, the number of games in that room that have been completed, if any of these games were no shows or cancelled, the escape rate in this room, the number of players who have been through the room, and the revenue for today. (Revenue settings can be toggled by visiting settings > point of sale).
Games Extended
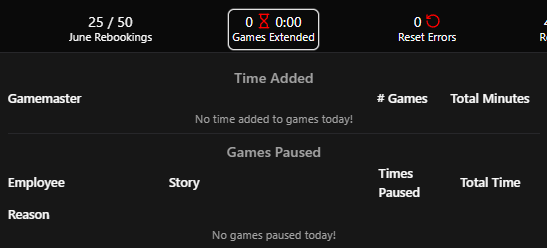
The games extended tab shows how many games have had time added or been paused by the game master and for how long.
The popup divides these two categories, showing which employee extended the game, the name of the game that was extended, and for how long. The time added section shows how many games were extended, and the games paused section shows how many times the game was paused.
Reset Errors
The reset errors tab counts the number of reset errors today.
The popup displays the time the reset error was logged, the employee who found the error, a description of what was wrong, and the last employee to reset the room.
Repairs
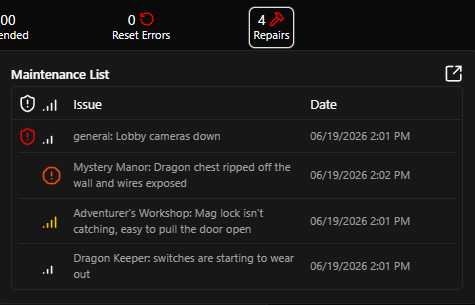
The repairs tab counts the total number of open maintenance issues/handyman tasks.
The popup lists when the issue was logged, a description of the issue, and the name of the employee who logged the issue.
Employee Metrics
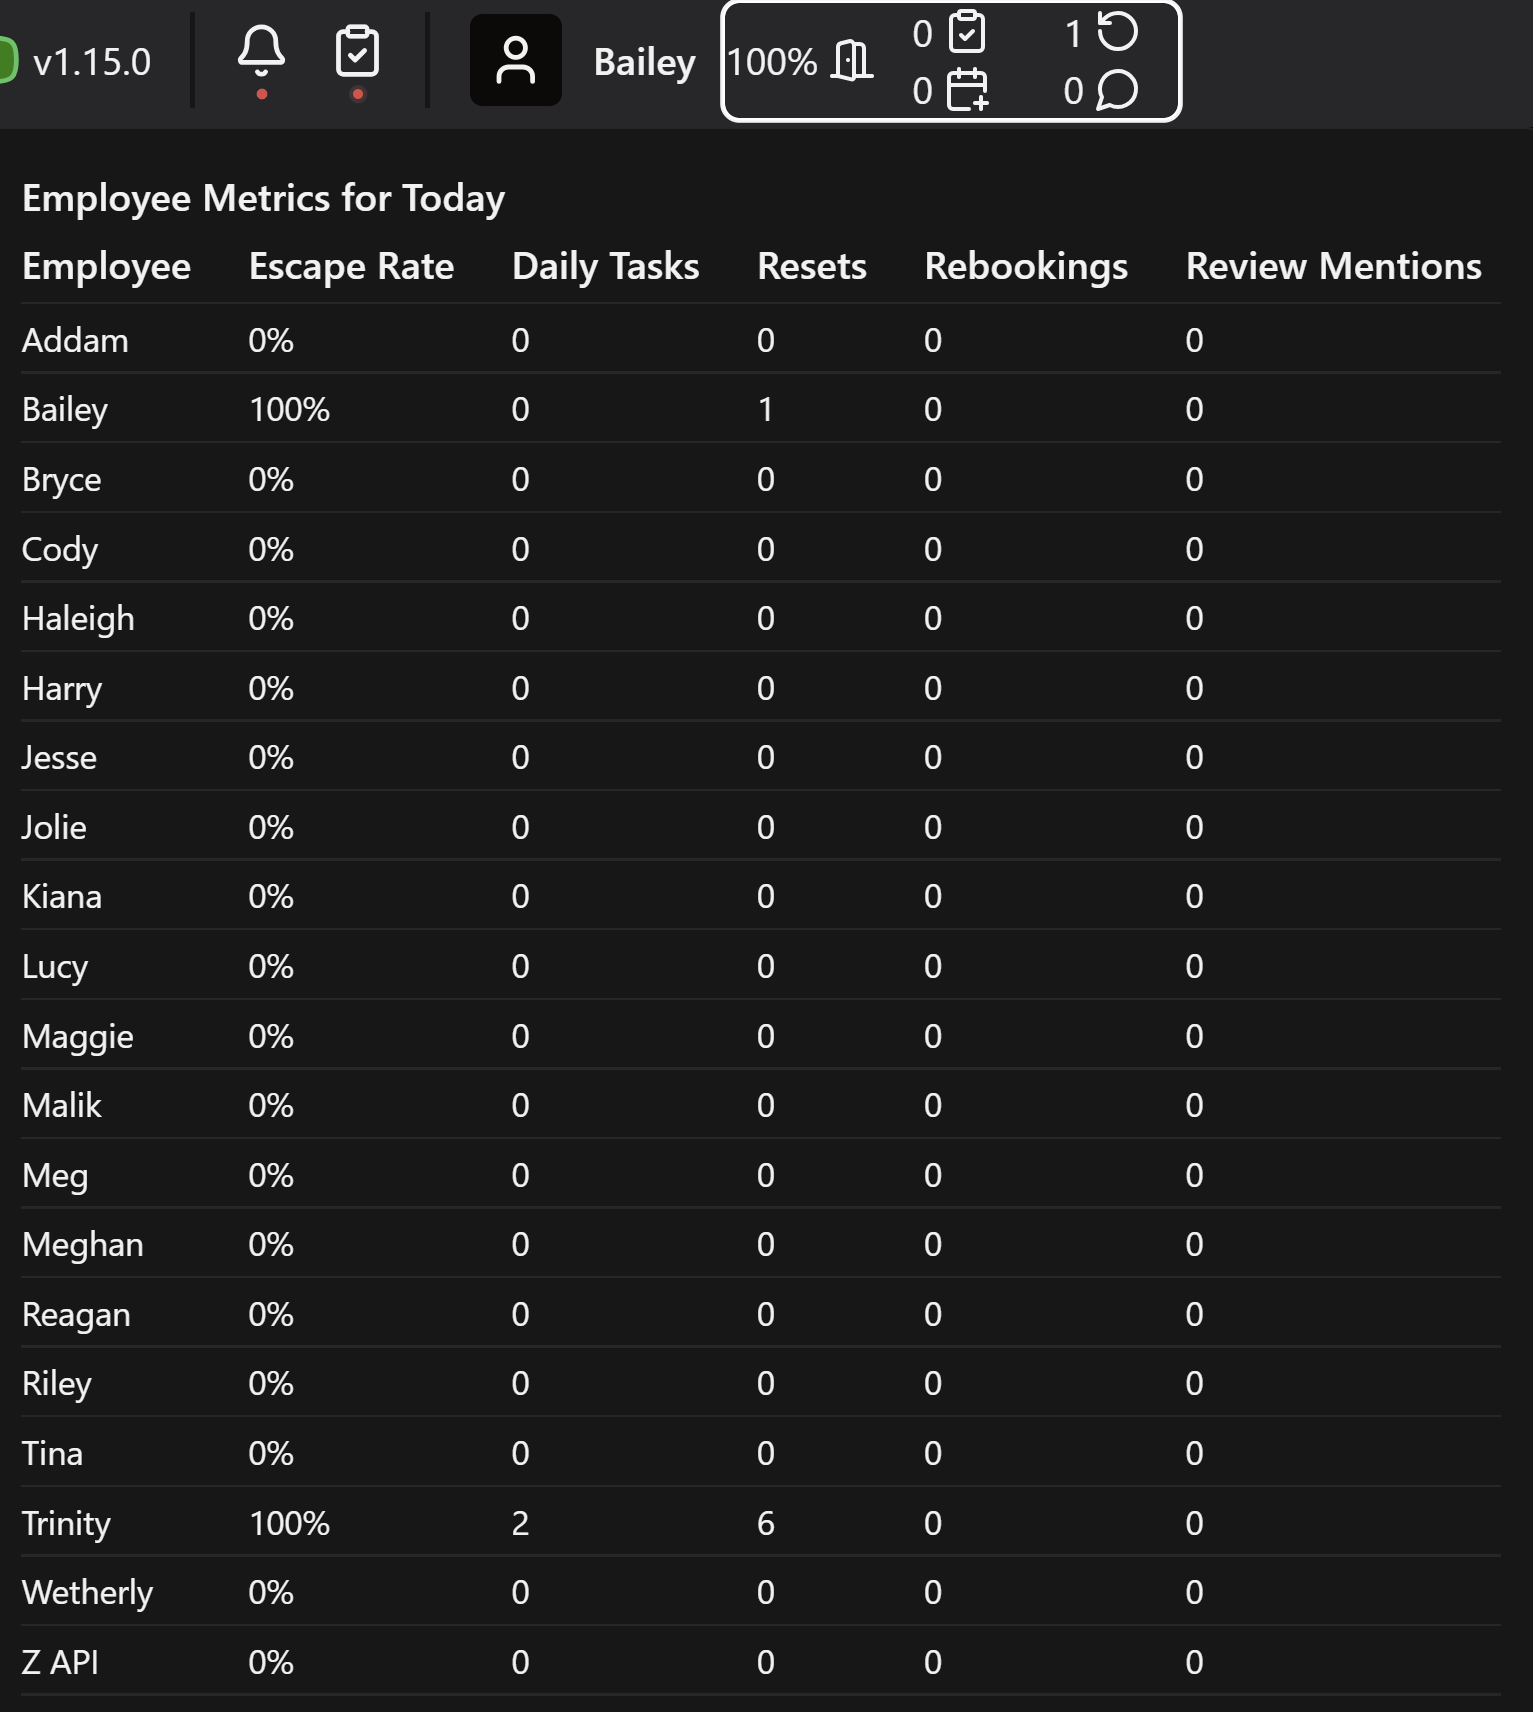
Employee metrics appear beside an employees name after they log in to Drawbridge and can be expanded by clicking on the icons there.
The icons in the navbar show an employee’s metrics in a day, including their escape rate, number of completed daily tasks, number of resets, number of rebookings, and number of Google reviews.
A popup appears when these icons are clicked on which shows the same metrics for all other employees today.
Personal Metrics
An employee’s personal metrics can be found by clicking on their name after logging in. These metrics are split into three different sections.
Host
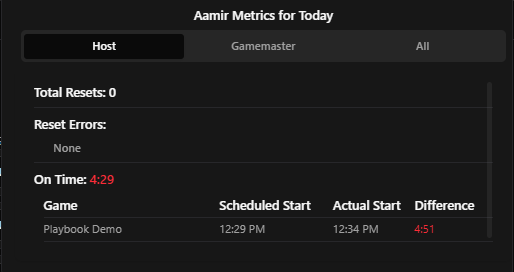
The hosting metrics show how many resets the employee has completed today and lists their times. The time will be green if it falls below the expected time it takes to reset a room (which can be configured in settings > point of sale) and red if it is longer than the expected time. If they did not time their reset, it simply shows N/A.
Also listed are the number of reset errors that the employee has had today, which game the error applies to, the description of the error, and the time it was logged.
An on time metric, similar to the overview on time metric, is also provided. This is calculated in the same way, but it only takes into account games that were hosted in by the selected employee.
The last hosting metric lists the number of rebookings that have been booked today and can be attributed to the selected employee. This lists the total number of rebookings as well as the name of each customer to rebook, the day they will return, the game that they will play next, and the number of players that they rebooked for.
Gamemaster
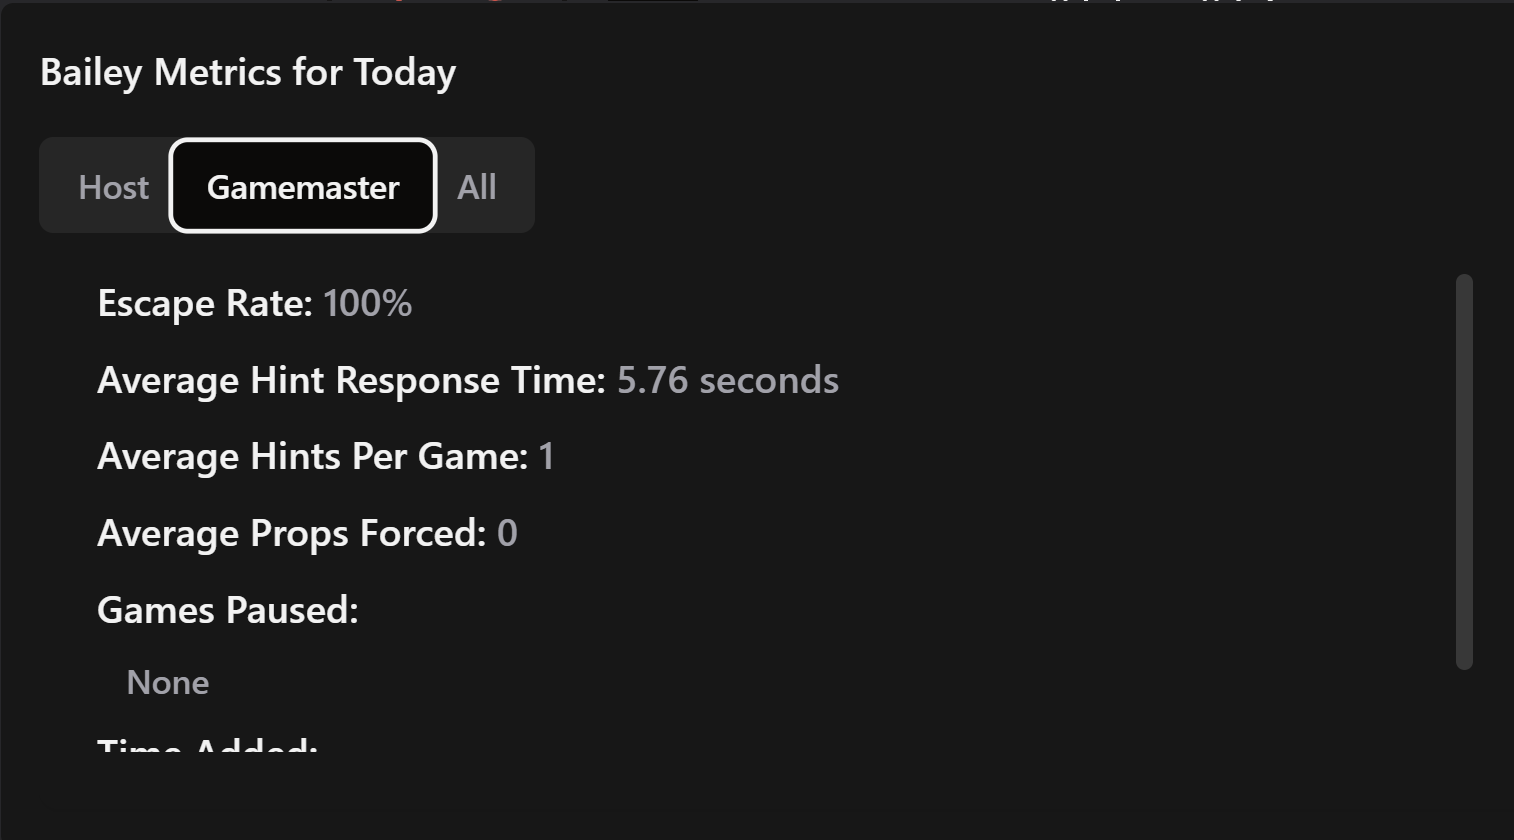
The gamemaster tab lists today’s escape rate for the selected employee, the average amount of time it has taken them to respond to a hint request, the average number of hints they have sent per game, the average number of props that they force per game, the games they have paused and for how long, and the games they have added time to.
All
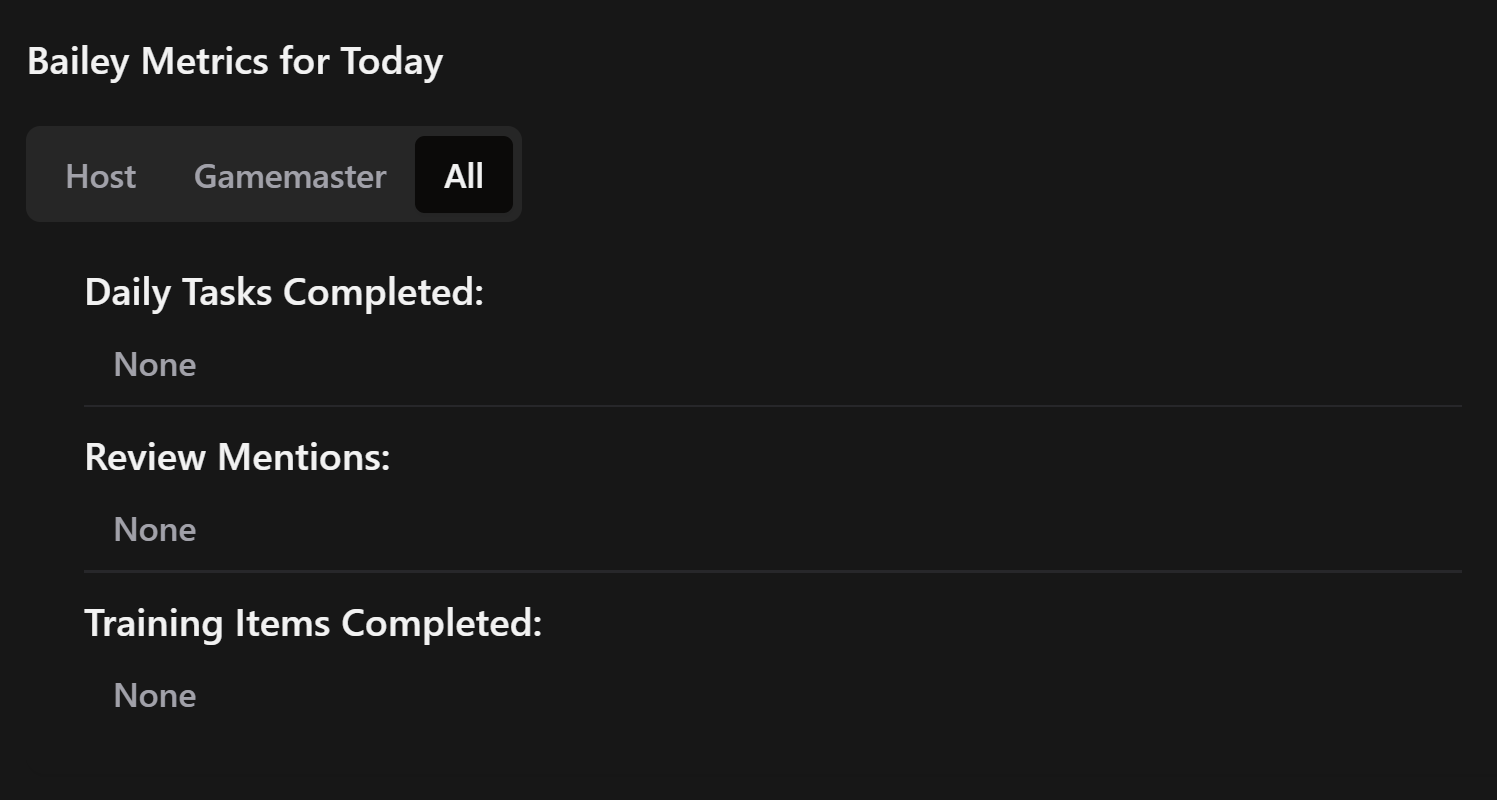
Under the All tab, it lists the daily tasks that have been completed by the selected employee today and at what time. It also lists any Google reviews by displaying the name of the reviewer, what star rating they left, and the text of the review. Lastly, it shows any training items that have been completed by the employee today and what time it was completed at.